


SAMHSA data checked November 16, 2026
How far is treatment from each Indiana county?
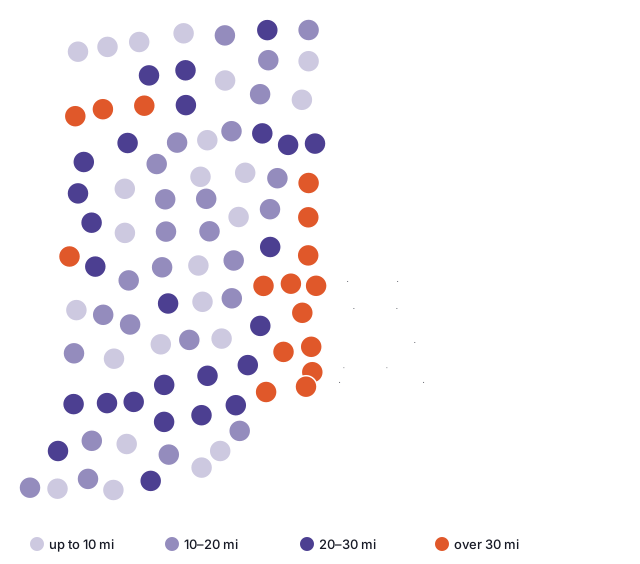
Our starting point was the middle of every county in Indiana, all 92 of them. From there, we counted miles to the nearest detox, the nearest live-in program and the nearest medicine clinic. 386,034 people live in the 16 counties where detox is more than 30 miles away. 10 counties lack any treatment site.
Before you call, grab the insurance card and ZIP code (yours or your family member's). It is a paid referral line. A partner answers, not any program listed here.
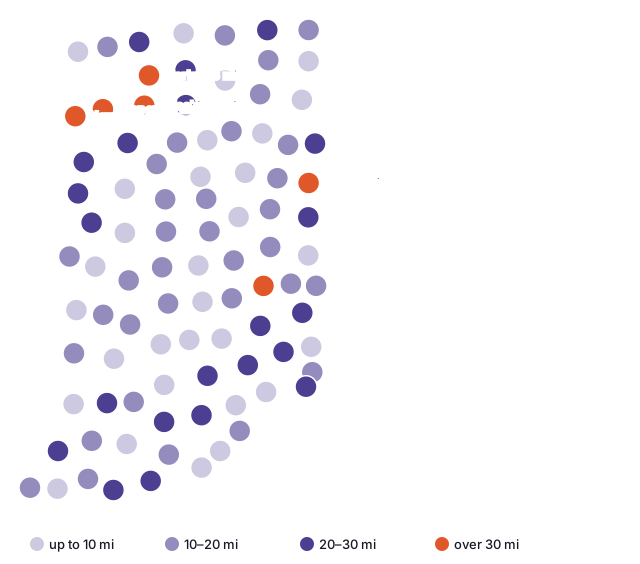
All 92 counties
Ordered by how far the closest detox is. Miles here are straight-line miles; by car the trip is longer.
| County | Population 2024 | Listed programs, this county | Detox, mi | Residential, mi | MAT, mi |
|---|---|---|---|---|---|
| Union County | 6,884 | 0 | 53.7 | 12.7 | 11.7 |
| Ohio County | 5,996 | 0 | 53.4 | 12.6 | 10.2 |
| Switzerland County | 9,988 | 0 | 51.8 | 20.5 | 18.9 |
| Dearborn County | 51,435 | 6 | 49.4 | 5.4 | 5.2 |
| Franklin County | 23,136 | 0 | 46.0 | 22.9 | 18.1 |
| Fayette County | 23,335 | 3 | 43.3 | 19.4 | 3.1 |
| Wayne County | 66,410 | 10 | 40.7 | 4.6 | 5.3 |
| Randolph County | 24,337 | 1 | 36.3 | 22.8 | 20.2 |
| Pulaski County | 12,421 | 1 | 36.0 | 38.8 | 5.7 |
| Jefferson County | 32,921 | 4 | 35.4 | 2.6 | 13.5 |
| Ripley County | 29,214 | 0 | 34.8 | 20.3 | 19.9 |
| Newton County | 14,131 | 0 | 34.3 | 34.3 | 22.4 |
| Jay County | 20,164 | 1 | 33.5 | 33.5 | 19.6 |
| Jasper County | 33,387 | 1 | 32.4 | 32.4 | 23.4 |
| Rush County | 16,759 | 1 | 32.1 | 31.9 | 17.7 |
| Vermillion County | 15,516 | 3 | 31.6 | 13.5 | 25.7 |
| Warren County | 8,451 | 1 | 29.1 | 29.1 | 17.3 |
| Benton County | 8,853 | 0 | 28.9 | 28.9 | 13.3 |
| Knox County | 35,872 | 8 | 28.3 | 6.2 | 5.4 |
| LaGrange County | 41,122 | 3 | 27.8 | 27.8 | 0.8 |
| Fountain County | 16,833 | 1 | 26.7 | 25.2 | 19.4 |
| Washington County | 28,345 | 1 | 26.5 | 25.9 | 18.6 |
| Perry County | 19,320 | 1 | 26.1 | 26.1 | 26.1 |
| Orange County | 19,824 | 1 | 25.8 | 21.1 | 1.7 |
| Fulton County | 20,004 | 1 | 24.9 | 24.9 | 17.7 |
| Adams County | 36,584 | 2 | 24.4 | 24.4 | 5.2 |
| Scott County | 24,751 | 4 | 23.9 | 6.7 | 1.0 |
| Daviess County | 34,097 | 2 | 23.3 | 22.1 | 5.2 |
| Gibson County | 33,038 | 1 | 23.3 | 20.9 | 20.9 |
| White County | 24,833 | 2 | 23.3 | 23.9 | 21.8 |
| Martin County | 9,864 | 1 | 23.2 | 19.5 | 19.4 |
| Jackson County | 47,420 | 3 | 22.8 | 21.3 | 11.3 |
| Morgan County | 73,825 | 6 | 22.8 | 12.7 | 4.5 |
| Parke County | 16,508 | 4 | 22.8 | 2.7 | 20.6 |
| Wells County | 28,798 | 1 | 22.8 | 19.3 | 2.3 |
| Huntington County | 36,944 | 3 | 22.4 | 4.5 | 4.2 |
| Lawrence County | 45,192 | 4 | 22.3 | 1.0 | 1.3 |
| Starke County | 23,463 | 1 | 22.3 | 33.4 | 1.6 |
| Decatur County | 26,421 | 2 | 21.8 | 22.2 | 2.8 |
| Marshall County | 46,464 | 0 | 21.4 | 21.4 | 18.1 |
| Jennings County | 27,634 | 2 | 21.0 | 20.3 | 0.6 |
| Henry County | 49,081 | 3 | 20.9 | 18.0 | 1.8 |
| Clinton County | 32,895 | 0 | 19.4 | 19.7 | 17.8 |
| Steuben County | 34,862 | 2 | 18.8 | 18.8 | 1.4 |
| Noble County | 47,811 | 3 | 18.6 | 18.6 | 0.6 |
| Crawford County | 10,523 | 2 | 18.4 | 18.4 | 18.4 |
| Owen County | 21,851 | 3 | 17.8 | 17.8 | 17.8 |
| Wabash County | 30,777 | 2 | 17.8 | 14.0 | 3.1 |
| Carroll County | 20,747 | 1 | 17.7 | 18.5 | 17.7 |
| Putnam County | 37,804 | 3 | 17.5 | 17.5 | 1.4 |
| Pike County | 12,116 | 0 | 17.1 | 15.8 | 17.1 |
| Brown County | 15,650 | 2 | 16.9 | 0.7 | 14.2 |
| Delaware County | 112,951 | 7 | 16.8 | 16.8 | 1.5 |
| Blackford County | 11,816 | 1 | 16.5 | 16.5 | 2.6 |
| Posey County | 25,067 | 1 | 16.3 | 15.5 | 15.5 |
| Boone County | 78,773 | 4 | 15.9 | 14.7 | 1.0 |
| Hancock County | 88,810 | 2 | 15.3 | 14.7 | 12.2 |
| Clay County | 26,424 | 1 | 15.0 | 15.0 | 15.0 |
| Sullivan County | 20,768 | 1 | 14.9 | 14.9 | 14.9 |
| Elkhart County | 207,436 | 6 | 14.4 | 14.4 | 1.3 |
| Cass County | 37,559 | 1 | 14.1 | 14.1 | 14.1 |
| Shelby County | 45,654 | 2 | 14.0 | 14.0 | 14.0 |
| Warrick County | 66,339 | 2 | 13.1 | 13.4 | 13.1 |
| Hendricks County | 190,629 | 8 | 12.7 | 14.0 | 5.5 |
| Whitley County | 34,885 | 1 | 11.4 | 11.4 | 2.5 |
| Hamilton County | 379,704 | 4 | 10.4 | 10.4 | 0.5 |
| Clark County | 127,479 | 17 | 10.1 | 10.1 | 3.5 |
| Tipton County | 15,324 | 2 | 10.1 | 10.1 | 2.1 |
| Montgomery County | 38,633 | 5 | 9.7 | 9.7 | 0.8 |
| Johnson County | 170,614 | 8 | 9.5 | 8.2 | 2.3 |
| Spencer County | 20,192 | 2 | 9.0 | 24.9 | 9.0 |
| Kosciusko County | 80,669 | 5 | 8.8 | 8.8 | 2.5 |
| Floyd County | 81,931 | 5 | 7.8 | 7.8 | 4.3 |
| Miami County | 35,613 | 3 | 4.7 | 4.7 | 4.7 |
| Greene County | 31,219 | 5 | 4.4 | 4.4 | 4.4 |
| St. Joseph County | 273,744 | 12 | 3.8 | 3.9 | 3.8 |
| Tippecanoe County | 191,650 | 7 | 3.7 | 3.7 | 2.4 |
| LaPorte County | 111,348 | 6 | 3.6 | 27.1 | 3.6 |
| Madison County | 134,222 | 11 | 2.9 | 2.9 | 2.9 |
| Vanderburgh County | 180,387 | 17 | 2.8 | 0.4 | 0.4 |
| Howard County | 84,082 | 15 | 2.6 | 0.7 | 0.7 |
| Dubois County | 43,629 | 4 | 2.4 | 2.4 | 2.4 |
| DeKalb County | 44,330 | 5 | 2.2 | 2.2 | 2.2 |
| Marion County | 981,628 | 68 | 2.2 | 1.1 | 1.1 |
| Vigo County | 106,166 | 13 | 2.2 | 2.2 | 0.3 |
| Porter County | 175,860 | 11 | 1.6 | 14.3 | 1.6 |
| Grant County | 66,458 | 8 | 1.4 | 1.4 | 1.4 |
| Allen County | 399,295 | 22 | 1.3 | 1.3 | 1.3 |
| Harrison County | 39,978 | 3 | 1.3 | 1.3 | 1.2 |
| Bartholomew County | 84,741 | 9 | 1.1 | 1.2 | 1.1 |
| Monroe County | 140,702 | 15 | 1.0 | 0.8 | 0.6 |
| Lake County | 502,955 | 28 | 0.8 | 0.8 | 0.8 |
Unsure what to do next?
Still comparing programs? Ask one on the list directly, or try the referral line below.
It is a paid referral line. A partner answers, not any program listed here.
Method
Facility source: SAMHSA FindTreatment.gov, using each Indiana listing that reports detox or substance use treatment (snapshot November 16, 2026). We placed county centers using the U.S. Census Bureau's 2024 Gazetteer. Population figures: Census 2024 estimates. Each facility is assigned to a county by ZIP code, based on the Census crosswalk of ZCTAs and counties. Distance is counted in great-circle miles, from a county's internal point to the coordinates a facility lists; if a SAMHSA listing has no coordinates, the Census Geocoder locates it from the address, or we use the ZIP code center when the street is missing. Certified opioid treatment programs (OTP) are included as MAT. Reuse of the data is fine with a link back to this page.